01
Semantic Models
Define trusted metrics and dimensions once for consistent reporting.
System capability
Reference architecture name: InsightBoard
Dashboards, ad hoc reporting, and metrics layers built on your operational and financial data.
Overview
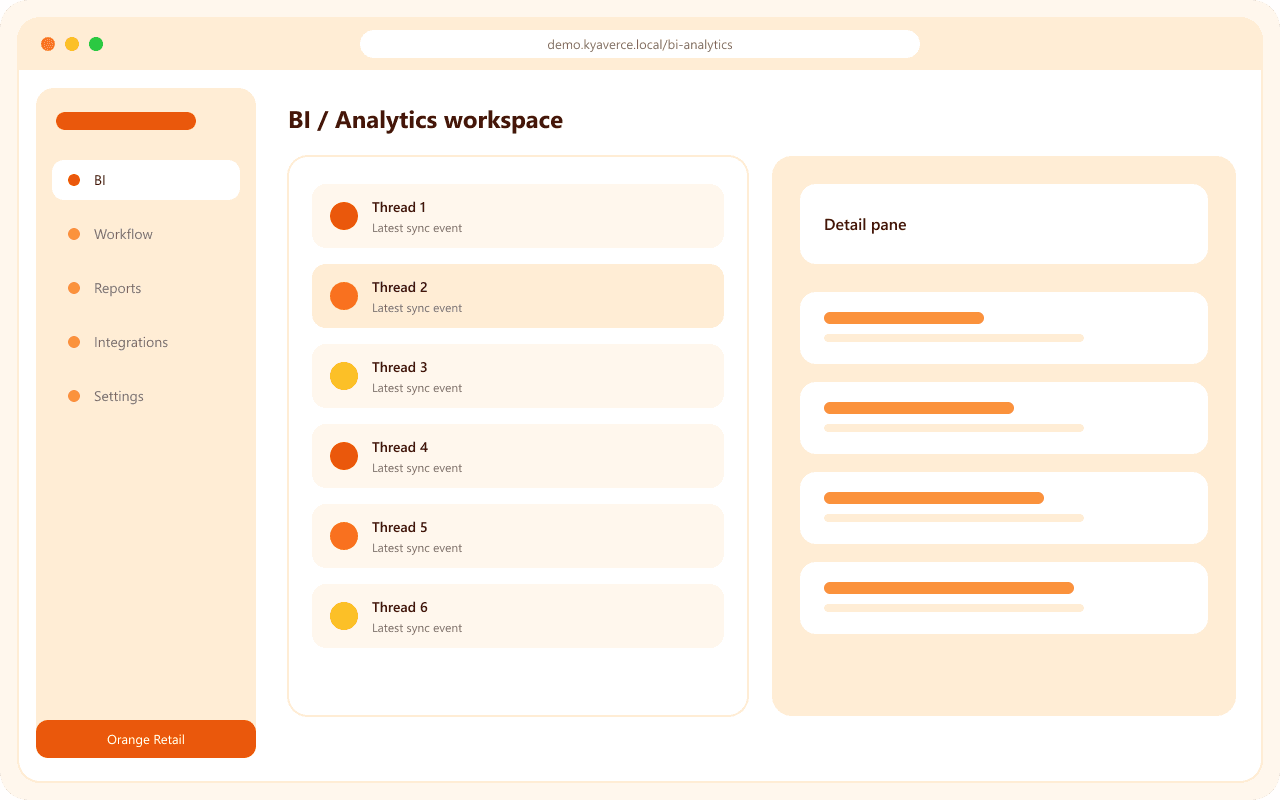
Business Intelligence & Analytics (BI) is a business system that consolidates related work in a single, traceable environment. Dashboards, ad hoc reporting, and metrics layers built on your operational and financial data.
Organizations typically need this capability when information is scattered, processes depend on a few individuals, and managers cannot obtain a clear picture of daily operations. A structured system reduces rework and makes responsibilities visible.
A well-designed implementation covers core records, workflows, reporting, and the integrations required with adjacent systems. Access can be aligned with roles so each team sees what it needs without unnecessary complexity.
The scope of work is defined by the organization’s processes, data, and priorities, rather than a generic template. Expected success indicator: Turn raw data into decisions leaders can trust without waiting on manual exports.
We design and implement Business Intelligence & Analytics (BI) according to your operating model: defined roles, shared data, and the integrations required for reliable daily use.
Challenges
Six primary modules for this capability are shown first. Use More capabilities to view a fuller list of modules we can include.
01
Define trusted metrics and dimensions once for consistent reporting.
02
Explore KPIs with filters that stay aligned to the same definitions.
03
Let analysts ask new questions without waiting for custom extracts.
04
Deliver refreshed packs to stakeholders on a reliable cadence.
05
Surface missing, late, or anomalous inputs before decisions.
06
Show each viewer only the slices they are allowed to see.
Illustrative ranges teams often aim for when this capability is implemented well — not results from a completed engagement.
30–45%
Typical cycle-time cut
45–65%
Typical manual-work cut
72–88%
Target weekly adoption
A maintainable stack we commonly use to deliver production-ready systems in this domain.
Business outcome
Outcome: Turn raw data into decisions leaders can trust without waiting on manual exports.
Tell us about your domain, constraints, and timeline. We will recommend a practical next step.
Discuss this capability